U.S. foreclosure data points to a sharp rise in repossessions, with lenders taking back 5,794 homes in August, a 42% increase from a year earlier.
That increase comes as many homeowners continue to deal with higher borrowing costs, insurance bills, and other household expenses.
New figures show foreclosure activity is climbing across the country, with lenders reclaiming significantly more properties than in the same period a year ago.
According to real estate data firm ATTOM, 5,794 properties were repossessed through completed foreclosures during the month.
That was 42% higher than the same month a year earlier and 22% above the previous month.
The data, reported by Black Enterprise, suggests growing financial pressure for some U.S. homeowners.
Even so, foreclosure activity remains below pre-pandemic levels, and the latest numbers do not indicate a housing crisis on the scale of the Great Recession.
The report offers a closer look at where foreclosure activity is rising, which states are seeing the most repossessions, and what the numbers say about the housing market.
Foreclosure Repossessions Rise 42%
ATTOM’s foreclosure market report recorded 40,277 U.S. properties with at least one foreclosure filing during the month.
That count includes default notices, scheduled auctions, and bank repossessions.
It was 13% higher than a year earlier and 1% above the prior month.
The report also showed 5,794 completed foreclosures, also known as real estate owned, or REO, properties.
These are homes that lenders have taken back through the foreclosure process.
That distinction matters because a foreclosure filing does not always mean a homeowner will lose the property.
A filing can represent an early stage, and some borrowers may resolve their delinquency before foreclosure is completed.
Key figures from the report include:
40,277 properties had foreclosure filings, up 13% year over year.
25,894 properties entered foreclosure, up 7% year over year.
5,794 properties were repossessed through completed foreclosures, up 42% year over year.
Completed foreclosures rose 22% from the prior month.
The data suggests more properties are moving deeper into the foreclosure process and reaching repossession than a year ago.
Still, these figures reflect different stages of foreclosure activity and should not be added together as if they represent separate properties.
Texas Has the Most Home Foreclosures
Texas recorded the highest number of completed foreclosures, followed by California, North Carolina, Arizona, and Alabama.
ATTOM’s figures show where lenders repossessed the most homes during the month.
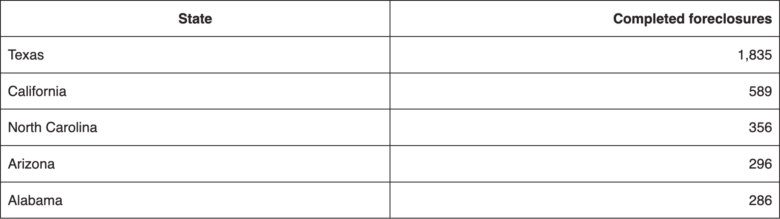
Texas had more than three times as many completed foreclosures as California, which ranked second.
But raw totals do not tell the full story.
States differ in population, housing supply, mortgage conditions, and the number of homes exposed to foreclosure risk.
Foreclosure rates, which compare filings with total housing units, offer another way to measure how concentrated the activity is.
South Carolina had the highest state foreclosure rate, with one in every 1,547 housing units receiving a foreclosure filing.
Nevada followed at one in 1,920, while Florida ranked third at one in 2,397.
Nationwide, one in every 3,569 housing units received a foreclosure filing.
Those figures help explain why the state with the most completed foreclosures is not always the one with the highest foreclosure rate.
Houston, Dallas, and San Antonio Top Metro Repossessions
Texas also led among major metropolitan areas for completed foreclosures.
Houston posted 448 completed foreclosures, followed by Dallas with 402 and San Antonio with 256.

These totals show how concentrated repossessions were in major Texas cities.
Still, the numbers alone do not explain why foreclosures happened there or whether homeowners in those markets are facing the same financial conditions.
To understand local foreclosure risk, additional context is needed, including home prices, mortgage delinquencies, household income, job trends, and housing supply.
Florida, Texas, and California Lead Foreclosure Starts
Foreclosure starts track properties entering the process, making them an important early sign of stress before repossession occurs.
ATTOM reported 25,894 foreclosure starts nationwide, up 7% from a year earlier but down 3% from the prior month.
Florida recorded the most foreclosure starts, followed by Texas and California.

That does not mean every home entering foreclosure will ultimately be repossessed. Some borrowers may catch up on payments, work out an agreement with their lender, sell the home, or take other steps.
Even so, rising foreclosure starts alongside higher completed foreclosures suggests the pressure is not confined to just one stage of the process.
Additional reports will show whether the increase continues.
What Is Driving the Increase?
According to ATTOM CEO Rob Barber, as cited by Black Enterprise, homeowners are being squeezed by higher household costs and borrowing expenses.
Mortgage payments, property taxes, insurance premiums, utilities, and routine bills can all strain a family budget.
When borrowers fall behind on mortgage payments, lenders may begin foreclosure proceedings if the delinquency is not resolved.
However, the latest report does not prove that any single cost is responsible for the rise in repossessions.
Several forces can affect foreclosure activity, including:
Borrowing costs: Higher mortgage payments, housing costs, and other debt obligations can reduce affordability, especially for borrowers with little financial room.
Insurance and housing expenses: Rising premiums and other property-related costs can leave less money available for mortgage payments.
Everyday expenses: Higher prices for basic necessities can pressure household budgets when wages do not keep up.
Local economic conditions: Employment, income, housing trends, and borrower situations can vary widely by state and metro area.
The latest numbers do support the conclusion that foreclosure activity has increased over the past year.
Pinpointing the exact causes would require more research into mortgage delinquencies, borrower finances, and local economic conditions.
The Market Is Rising, but Not at Great Recession Levels
The increase in repossessions is notable, but historical context matters.
ATTOM has said foreclosure activity remains below pre-pandemic levels, even with more frequent year-over-year increases.
That distinction is important because the Great Recession brought widespread housing distress, with falling home values, mortgage defaults, and foreclosures affecting households and financial institutions nationwide.
The latest data does not suggest a return to those conditions.
Instead, it shows foreclosure activity rising from relatively contained levels, with certain states and metro areas seeing much more activity than others.
A 42% annual increase in completed foreclosures is significant, but percentage change alone does not fully capture the long-term scope of the issue.
The number of affected properties, the foreclosure rate, and comparisons with earlier years are all needed to judge the broader market.
First-Half Data Shows a Wider Trend
The latest report follows a broader rise in foreclosure activity over the first half of the year.
ATTOM said 227,548 U.S. properties had foreclosure filings during the first six months of the year, up 21% from the same period a year earlier and 28% from the first half of the prior year.
Completed foreclosures rose 33% year over year during that stretch, while foreclosure starts increased 18%.
Those figures suggest the latest monthly jump was part of a broader annual pattern rather than a one-month anomaly.
At the same time, year-over-year gains do not guarantee the trend will continue at the same pace.
More reports will be needed to see whether the increase accelerates, levels off, or reverses.
What Homeowners Should Take From the Data
For homeowners, the main takeaway is the difference between an early foreclosure filing and a completed repossession.
Receiving a foreclosure notice does not automatically mean a home will be taken away.
The result depends on the borrower’s circumstances, the stage of the process, state law, and whether the delinquency can be cured.
Homeowners having trouble making mortgage payments can contact their mortgage servicer to ask about loss-mitigation options.
The Consumer Financial Protection Bureau also offers guidance on mortgage trouble and foreclosure prevention.
For readers following the housing market, the most useful measures to watch are foreclosure starts, completed foreclosures, mortgage delinquency rates, and foreclosure rates relative to local housing supply.
Together, those indicators give a clearer picture of whether financial stress is spreading.
Bottom Line
U.S. foreclosure data shows a major rise in repossessions, with lenders taking back 5,794 properties in the month, up 42% from a year earlier.
Total properties with foreclosure filings climbed 13% year over year to 40,277, while foreclosure starts rose 7% to 25,894.
Texas recorded the most completed foreclosures, and South Carolina posted the highest state foreclosure rate.
Houston, Dallas, and San Antonio led major metro areas in completed repossessions.
The numbers suggest growing financial strain for some homeowners, but ATTOM’s data also shows foreclosure activity remains below pre-pandemic levels.
In other words, the latest figures point to a meaningful increase in foreclosure activity without showing that the U.S. is heading into another housing crisis like the Great Recession.
More from Digilifetrends
If Your Spouse Passes Away but Their Name Is Still on the Mortgage, What Happens?
When a spouse dies, the emotional toll is heavy enough without also fearing the loss of a home. Yet many surviving partners are surprised to find that the mortgage still carries…
6 min read · Updated 2026-10-25Real Estate Expert: Key Things to Weigh Before Buying or Selling a Home
Before you decide whether to buy or sell a home, it is important to think about the risk of negative equity and what it could mean for you. Right now, that risk exists on both…
3 min read · Updated 2026-10-25What the Property Brothers Say You Should Know Before Buying a Mobile Home
In an episode of "Chasing the West," a young couple searching for an affordable ranch turned to Jonathan and Drew Scott for help. The twin brothers, known for HGTV shows such as…
2 min read · Updated 2026-10-25